Tools to Analyze Voting Polarization
In a given election, did members of various racial/ethnic groups have systematically different preferences than others? This is called “racially polarized voting” (or RPV), and assessing it is a key element in ascertaining the fairness of electoral systems to minority groups. Under the current Voting Rights Act, a system may violate the law if sizeable minority groups have distinct preferences that are consistently thwarted. But we have a secret ballot! You don’t mark your name, and you certainly don’t mark your race, when you cast your vote. This means that we have to apply statistical inference methods to “learn” patterns of voting by race.
Taking data that is aggregated one way (vote totals by precinct) and guessing how to aggregate it a different way (vote share by race) is called the Ecological Inference Problem, and it’s a thorny problem with lots of known paradoxes. But nevertheless we can try to use sound methods and stay mindful of our confidence and uncertainty.
The simplest reasonable thing you could do is just look for patterns in the precinct-level results:
if the precincts with the most Black voters tend to have the strongest vote share for Candidate A, then probably Black voters prefer A overall. Fitting a simple line to this pattern is called Ecological Regression, or ER. But for the last few decades, the most widely used family of methods
for RPV is called Ecological Inference, or EI. The most sophisticated version that’s in wide use is a hierarchical Bayesian model that tries to fit
a probability distribution to every precinct that models how members of each group might vote.
The MGGG Redistricting Lab has recently released the sixth iteration of PyEI, a Python library that consolidates different ER and EI models into a single package. We built PyEI because Python, especially with PyMC, is a programming language well suited to do the hard part of EI (namely, MCMC runs to learn good coefficients for the probability distributions) in a transparent way that parallelizes nicely. PyEI consolidates many different methods into one open-source Python library.
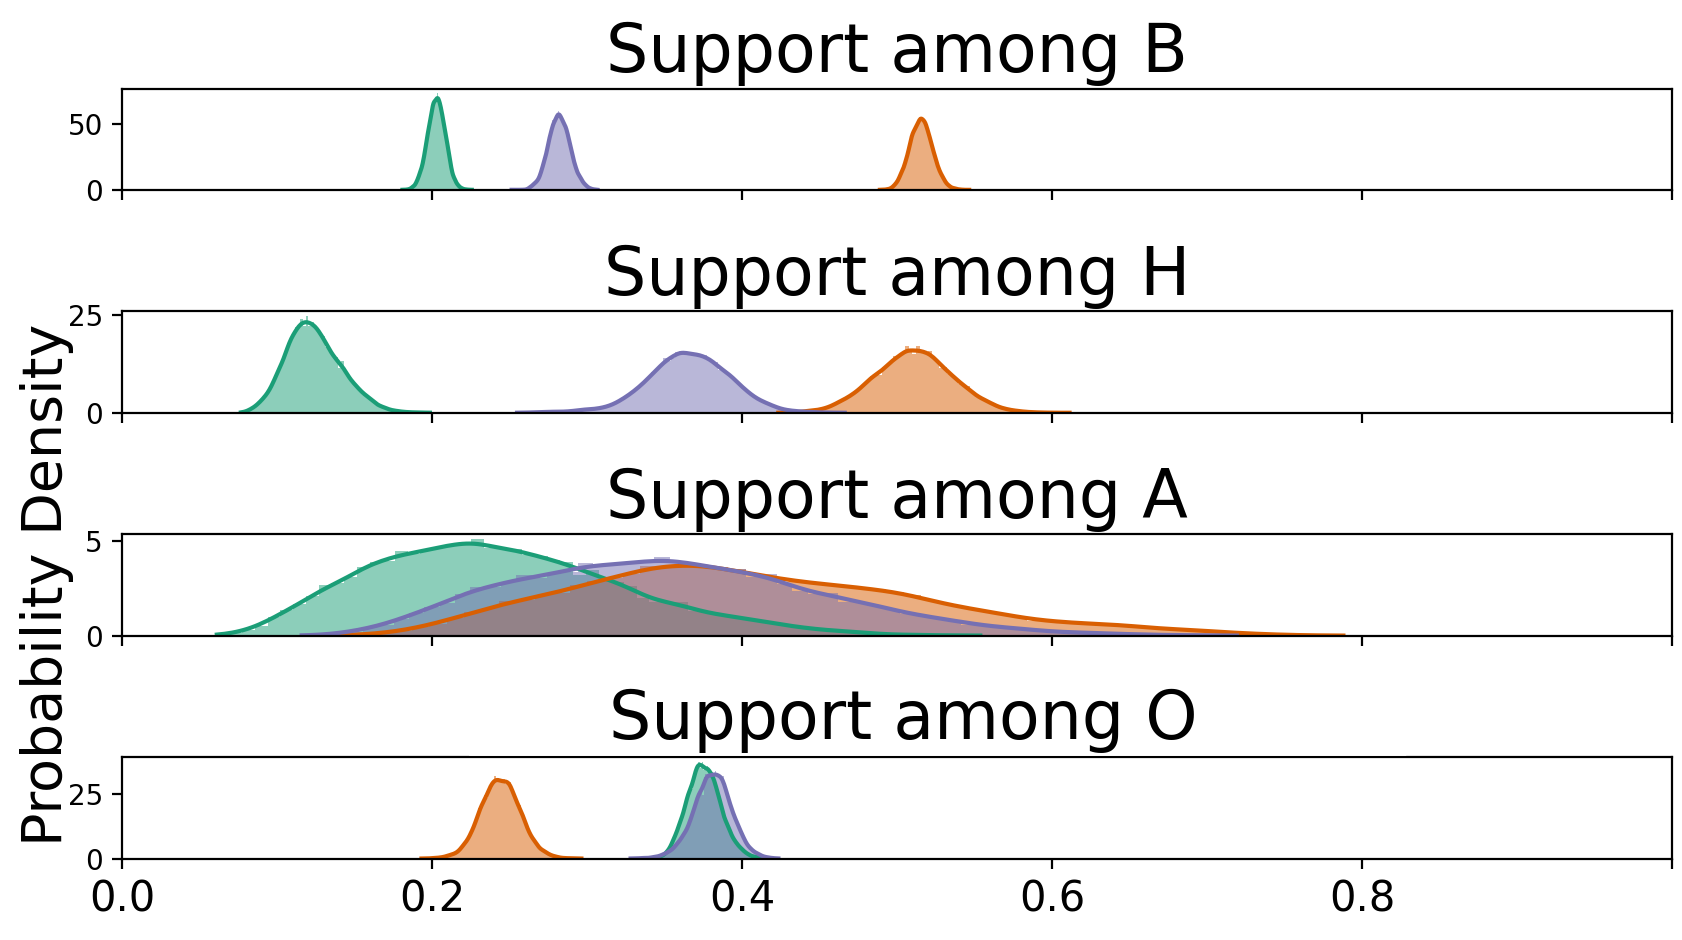
PyEI has lots of QA checks and convergence heuristics built in, and produces visuals that emphasize both the estimate and the uncertainty. A plot like the one above shows us inference results for Black (B), Hispanic (H), Asian (A), and Other/White (O) voting in a Democratic primary election in Texas. (The different colors are different candidates.) The skinny bell curves tell us that the model is fairly confident about the support level of Black and Other/White voters for the candidates, but there’s a bit less certainty about Hispanic preferences and much less certainty about Asian preferences. Without distributional information like this, just the point estimates (the mean values) would give us potentially very misleading picture.
By building this comprehensive library, MGGG and contributors hope to offer a manageable package for both new and experienced voting rights litigators and experts, as well as academics and other researchers. We hope the ease of comparisons will also facilitate the development and benchmarking of novel methods for RPV analysis.
For anyone interested in learning more about how to use EI and how to compare how various modeling decisions impact final results, check out the intro and example notebooks on GitHub. Of course, you can also contact the Lab if you have more questions about how to use this library or about EI in general.
As always, contributions are welcome!